An infographic is a fascinating blend of visual data and minimalistic text, presents information clearly, swiftly, and effectively. Infographics are not just a thing of past but its usage among B2B marketers has increased the most in the last four years, reaching 67% in 2024. Today, Marketers also believe in the power of visuals and they use different types of infographics in their content marketing strategy including statistical, timeline, flowchart, informational and list infographics. About 49% of them find visual marketing very important, 22% think it’s important, and 19% say that their strategy depends on visual content. If you are not using infographics in your content marketing, you are seriously missing out.
Infographics can increase website traffic by up to 12% and it is 30 times more likely to be read than a well written article. It is an effective way to spread information (the “viral” process) across many social networking sites and receive 3X more likes and shares on social media than any other type of content. In this research article, our Tashheer research team compiled a list of 8 benefits of using infographics for your content marketing. If you are interested to learn more about some professional ideas for your social media content, then read our article 10 Best Social Media Content Ideas.
List of 8 Advantages of Info-graphics in your Content Marketing
Here is the list of the best 8 benefits for using infographics for your content marketing in Pakistan, listed as:
Infographics Can Improve Decision-Making
They Increase Your Content’s Exposure
Enhances Content Share ability
Infographics Can Build Brand Credibility
They Complement Your Branding Strategy
Infographics Can Build High-Quality Backlinks
They Help Improve Your SEO
Infographics Help You Tell a Story
Infographics Can Improve Decision-Making
Pictures, charts, graphs, and icons help your brain understand things faster. When your brain understands things faster, you can make decisions more quickly. This can be helpful when presenting complex ideas such as breaking down academic research in a simply digestible manner. The mind processes information in pictures much faster than in words, and humans are inherently visual creatures. If you are trying to comprehend something complicated, infographics help your brain work through it quickly. Infographics excel at presenting comparisons and trends. Whether it is comparing sales figures, analyzing market trends, or evaluating performance metrics, infographics enable decision makers to identify patterns and make data driven decisions with greater confidence.
For example, Nike, the popular shoe company that made a hit with customers for their excellent quality and catchy logo, created this infographic that inspired people to “keep doing it!” Here are some points that tell us how infographics can significantly improve decision-making:
They Increase Your Content’s Exposure
Creating infographics takes time and resources because you need to gather a lot of information. After collecting the data from different sources, you have to spend more time to analyze. Not every infographic needs to be completely new but when you put effort into making your infographics, sometimes others will share them too. Your company can be best promoted when your content and visuals include meaningful info for viewers. You can Increase your potential reach by publishing infographics that are:
See more: What is Snackable Content and How to Effectively Produce Snackable Content
Enhances Content Share ability
Visual content tends to generate higher levels of engagement compared to plain text. It encourages interaction through shares and comments as audiences find them interesting and informative. Infographics should not only be easy to consume but also easy for readers to share. Stylish infographics make your brand look good, showing professionalism and expertise. When audiences share your infographics, they also help spread awareness of your brand, potentially attracting new followers and customers.
To improve your infographic’s sharability your business should:
Infographics Can Build Brand Credibility
Creating informative and interesting graphics can help the Pakistani audience learn more about you or your business and be seen as a voice of authority. By placing yourself as an expert in your industry, you not only become a thought leader in your niche but also build credibility for your brand. Become a reliable source by creating an original infographic, power-packed with useful resources and relevant images. Whether used in presentations, social media posts, email newsletters, or blog posts, infographics maintain their efficiency in communicating important messages.
To build credible infographics, you can use the following tips:
They Complement Your Branding Strategy
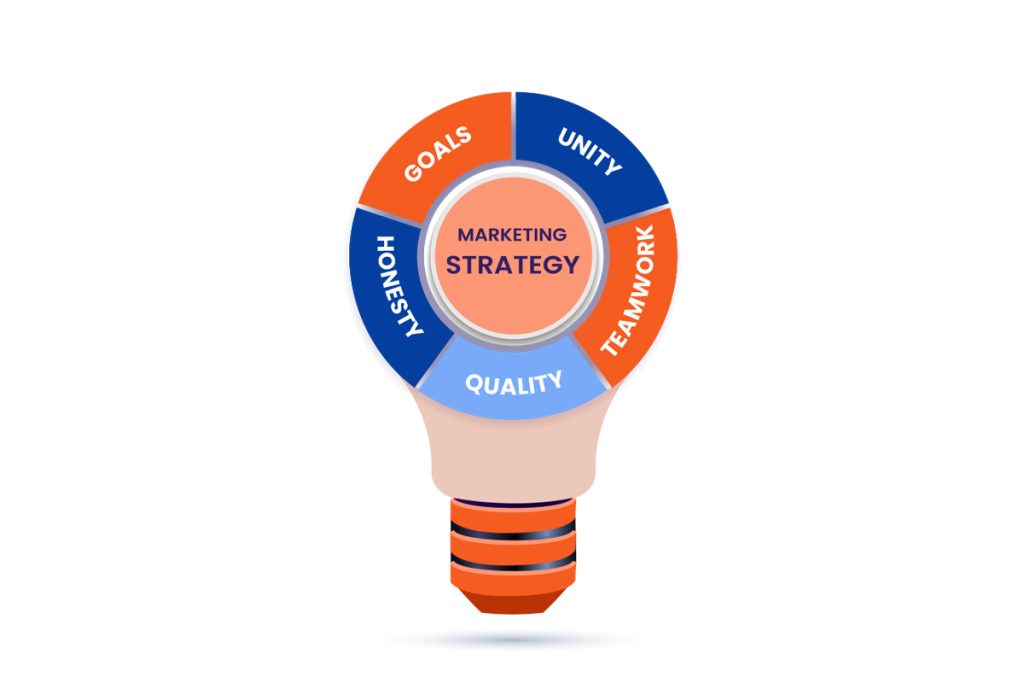
For your content marketing plan to be successful, it needs to line up with your brand’s message and identity. When people see an infographic from your company, whether on your website or somewhere else, they should know it’s yours because of its special style, as infographics complement your brand strategy. If you do it well, your audience will recognize your infographics easily. Make your infographics fit your brand by changing colors, fonts, and where you put text. This helps people notice your brand more and trust you. The tone and style of the infographic’s text should reflect your brand’s voice.
For example, imagine your company offers eco-friendly cleaning solutions.
Infographics Can Build High-Quality Backlinks
Infographics have proven to be useful in increasing engagement, driving traffic, and building backlinks for search engine optimization (SEO) purposes. Link building allows your business to rank higher in Google’s organic search engines. But the links should be from good websites related to your business. Some sites might not accept guest posts but may publish infographics. They might also add a link to your infographic in their existing content if it fits. This helps you get good backlinks and improve your website’s authority while also engaging users. Infographics are a great way to get backlinks for your brand, just like many other brands have done. To maximize the impact of infographics on backlink building efforts, brands should leverage optimized distribution channels.
See more: Different Tips for Creating Content That Continually Grabs Attention
Help Improve Your SEO
Plus, infographics are one of the most versatile kinds of content for any business and can seriously improve visibility. It is an ideal tool for attracting more traffic to your website, enhance your ROI and increase conversion rates in Pakistan. Plus, Infographics can be optimized with relevant keywords and metadata, making them more discoverable in search engine results. Think about the last few pictures with lots of information you have seen and where you found them. Infographic images are used extensively online for many purposes including blog posts, email marketing, social media ads, etc.
You probably saw one while scrolling on your phone or computer today. When infographics are made well and promoted effectively, they can make more people interested and lead to more sales or actions. To increase your website’s visibility on currently popular search engines, make sure to include alt text, a title, and a description of your infographic. There are several useful ways to improve SEO but one best way to get started is by making sure your infographics for SEO are shareable. When people share them a lot, they might link to your site which can help your chance to show up higher in search results.
Infographics Help You Tell a Story
Infographics can help audience understand complex concepts and ideas by using visual encouragements such as charts, graphs, or diagrams. They can use both text and images in a visual format to explain concepts. It is often used for marketing purposes but it can be useful when writing articles or sharing research too. However, if an infographic doesn’t express its viewers something new, they will quickly lose interest. Instead, make sure the infographic has a balanced mix of interesting words that tell a story and useful information to make it look nice and grab attention. Think about how people read a book from beginning to end. Interesting stories have a clear structure, focus, and purpose. Your infographics should be the same way.
Highlights of Infographics in Content Marketing
Here is the brief description of each advantage given below.
| Advantage | Description |
| Improved Decision-Making | Visuals are processed faster than text, allowing viewers to grasp information quickly and make informed choices. |
| Increased Content Exposure | Infographics are visually appealing and attract attention, leading to wider sharing and reach. |
| Enhanced Shareability | The concise format and visual nature of infographics make them ideal for sharing on social media and other platforms. |
| Builds Brand Credibility | Well-designed infographics show expertise and professionalism, establishing trust with the audience. |
| Complements Branding Strategy | Infographics can be designed to incorporate brand colors, fonts, and logos, supporting brand identity. |
| Builds High-Quality Backlinks | When other websites share your infographic with a link back to your source, it improves your website’s SEO ranking. |
| Improves SEO | Search engines favor content with relevant visuals, and infographics can improve search ranking through image recognition. |
| Effective Storytelling | Infographics can present complex information in a clear and engaging narrative, making it easier to understand and remember. |
Final Words
Infographics are more likely to catch the attention of the audience or potential customers. A recent study found that Infographics can increase website traffic by up to 12%. In this research article, our Tashheer research team compiled a list of the top 8 benefits of using infographics for your content marketing in Pakistan. Whether you are just getting started with making a simple infographic or you are a seasoned pro, these 8 benefits are the type of content that belongs in any social media marketing strategy.
